Report templates
PeakTMS allows to define report templates. Report templates are used to generate reports for your resources. The report templates can be defined by your administrator for different resource and activity types. Reports can be created with
- MS Excel
- MS Word
The report template list view
The list view provides you with an overview over all currently registered report template. You can use the table headers to define filters or to change the column width and order. Pressing the column chooser icon will give the possibility to add additional columns, e.g. about the change history.
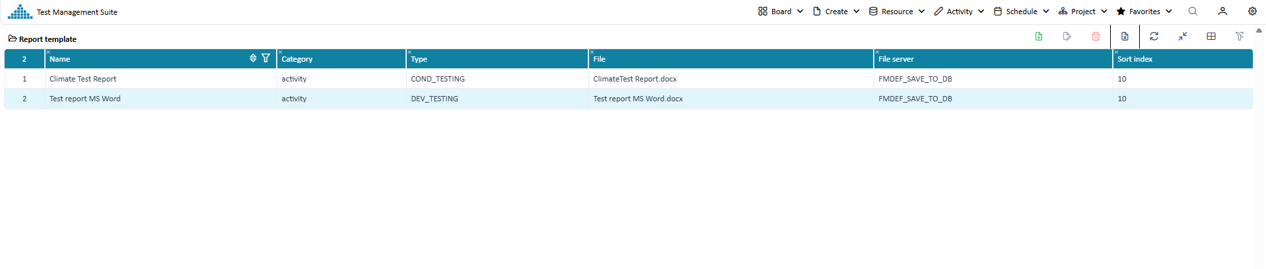
Overview registered report templates
Create / Edit a report template
Press the create or edit button. In the upcoming edit mask fill the relevant properties
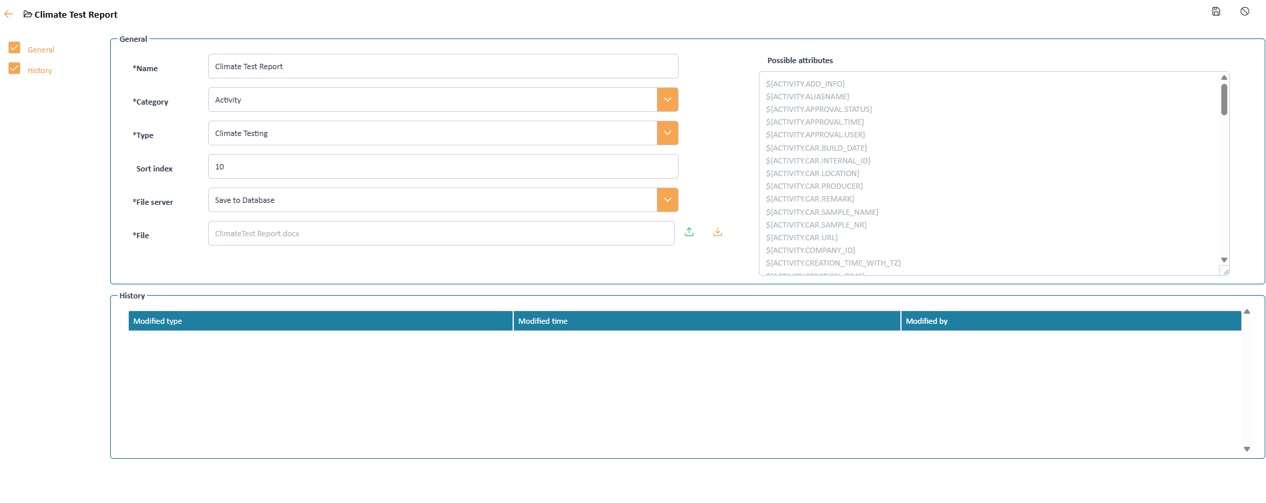
Input mask to define the user properties
Report template properties
A report template is specified by the following information
Name Category Type File server File Possible attributes Design a report
Report template can be defined based on either Word or Excel. All possible variables will be listed in “Possible attributes” field in the report template definition. From here they can be directly copied into the Excel / Word template.
Independent of the business objects following parameters can be added into a document
${REPORT.GENERATIONDATE} ${REPORT.GENERATIONDATE_WITH_TZ} ${REPORT.TIME_ZONE} The following diagram shows an example for a word template:
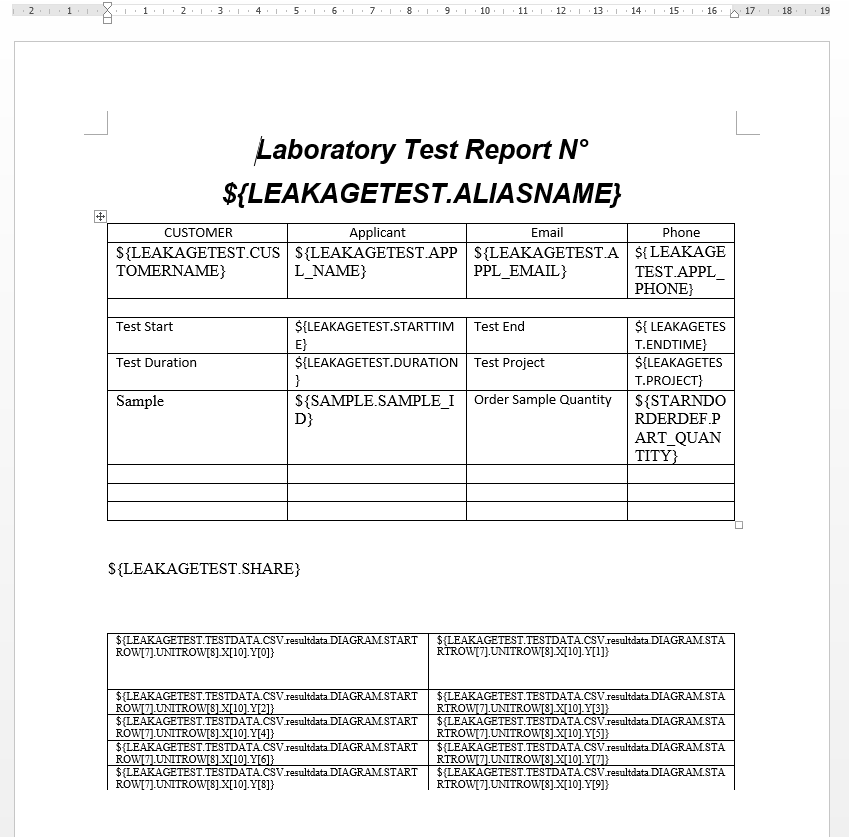
Example of a MS Word template
For different datatypes of attributes within activities there are different ways to include information into the reports
TEXT, TEXT_LONG, BOOLEAN, NUMBER, IDGENERATOR, MULTISELECTLIST, VALUELIST, ROOT_VALUELIST, TEMPLATE_VALUELIST, STATUS_ENGINE, COMPOSE
The value for this attribute will directly replace the value expression in the MS Word/ MS Excel.
- Value Expression:
${ACTIVITY.<ATTRIBUTE_MANUAL_ID>} - Value Expression example:
${LEAKAGETEST.CUSTOMERNAME} - Resolved Value example: John Doe
DATE
- Value Expression:
${ACTIVITY.<ATTRIBUTE NAME>} - Value Expression example:
${LEAKAGETEST.RECEIVEDATE} - Resolved Value example: 2021-03-11
The entry “el.dateformat” in the webapp.properties will be used as a format string which format the value to show in the report.
DECIMAL
- Value Expression:
${ACTIVITY.<ATTRIBUTE NAME>} - Value Expression example:
${LEAKAGETEST.AVG_SPEED} - Resolved Value example: 3.14
FILE_MANAGEMENT Single file
Specific image will be extracted and pasted into the document, the value expression format would be ${LEAKAGETEST.TESTDATA<Name for FILE_MANAGEMENT attribute>}
Declaration in table cell in MS Word
Generally it is advised to place pictures into table cells. If the value expression is in a table cell, the cell width will be used to scale the image width.
- Value expression: in table cell in word
- Value Expression:
${ACTIVITY.<ATTRIBUTE NAME.IMAGE.<FILE NAME>}
Example declaring a single picture
- Resolved value example:
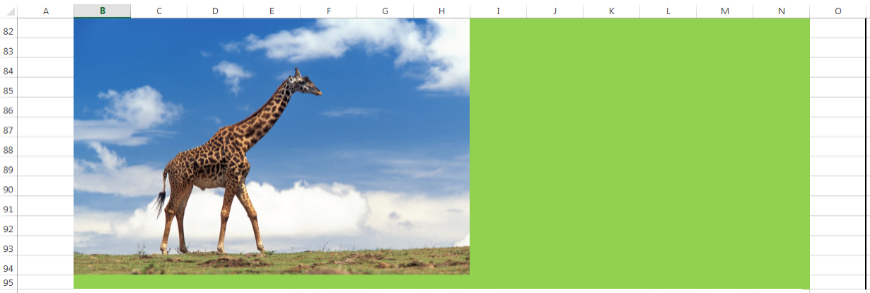
Example single picture in generated report
Declaration in a paragraph in MS Word
Placed without surrounding container the image would be scaled to 250px width.
- Value Expression:
${ACTIVITY.<ATTRIBUTE MANUAL ID>.IMAGE.<FILE NAME>} - Value Expression example:
${LEAKAGETEST.TESTDATA.IMAGE.LEFT} - Resolved Value example:
Declaration in MS Excel
Description & Comment If the value expression is covering certain amount of cells, all width of those cells will be used as image width
- Value Expression:
${ACTIVITY.<ATTRIBUTE MANUAL ID>.IMAGE.<FILE NAME>} - Value Expression example:
Example declaring a single picture
- Resolved Value example:
Example single picture in generated report
FILE_MANAGEMENT collection of images
The system will extract all image files (JPG or PNG) in this FILE_MANAGEMENT in the word/excel if the attribtue is declared as file collection:
- Value Expression:
${ACTIVITY.<ATTRIBUTE MANUAL ID>.IMAGES} - Value Expression example:
${LEAKAGETEST.TESTDATA.IMAGES} - Resolved Value example:
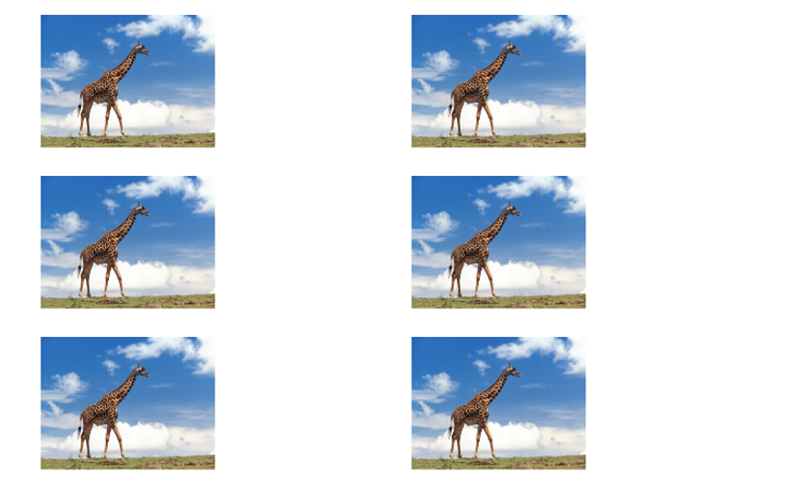
Collection of files in generated report
FILE_MANAGEMENT CSV diagram
For CSV files the generator allows to generate graphs based on the data in the CSV file.
- Value Expression:
${ACTIVITY.<ATTRIBUTE MANUAL ID>.CSV.<FILE NAME>.DIAGRAM.STARTROW[s].UNITROW[u].X[x].Y[y]} - Value Expression example:
${LEAK-AGETEST.TESTDATA.CSV.resultdata.DIAGRAM.STARTROW[7].UNITROW[8].X[10].Y[0]}
The following parameters will be described:
- STARTROW: row in csv file at which the data table starts
- UNITROW: unit row for the data (could be ignored, no unit row will be used)
- X: column for axis X ((could be ignored, axis X will start from 1)
- Y: column for axis Y
The width of diagram will be calculated by:
- For MS Word, if value expression is in a table cell, the width would be the cell width
- For MS Word, if value expression is directly in a paragraph, the default width is 250px;
- For MS Excel, if the value expression is in certain amount of cells, all width of those cells will be used as image width
The height of diagram will be adjusted automatically.
Resolved Value example:
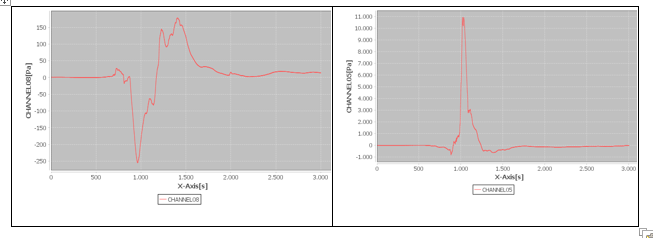
Generated Diagrams
OWN_OBJECTLIST
Own object lists will be presented the same as in the UI as a table. The table configuration for the own object will be used as table column to create the table with the data values in the MS Word / MS Excel
- Value Expression:
${ACTIVITY.<ATTRIBUTE MANUAL ID>} - Value Expression example
${LEAKAGETEST.PROBLEMLIST}Resolved Value example:Generated table based on OWNED_OBJECTLIST columns
USER
-
Value Expression:
${ACTIVITY.<ATTRIBUTE MANUAL ID>.<USER FIELDS>} -
Value Expression example:
${LEAKAGETEST.APPLICANT.phone}The following will properties of the user are available for being placed in: -
loginname
-
familyname
-
givenname
-
email
-
phone
-
Resolved Value example: Phone: 1234567890
APPROVEREJECT and APPROVE
Status of current approve/deny field
- Value Expression:
${ACTIVITY.<ATTRIBUTE MANUAL ID>.STATUS} - Value Expression example:
${ACTIVITY.TEST_RESULT_APPROVED.STATUS} - Resolved Value example: APPROVE
Information about the user who approve/deny the field
- Value Expression:
${ACTIVITY.<ATTRIBUTE MANUAL ID>.USER} - Value Expression example:
${ACTIVITY.TEST_RESULT_APPROVED.USER} - Resolved Value example: John Doe
Information about the time when the user approve/deny the field
- Value Expression:
${ACTIVITY.<ATTRIBUTE MANUAL ID>.TIME} - Value Expression example:
${ACTIVITY.TEST_RESULT_APPROVED.TIME} - Resolved Value example: 2021-03-11 17:47