Project planner
The project plan is your place to plan and steer your projects. It gives a quick overview over all project tasks and allows for rescheduling. Additionally, it allows to track and maintain relations between the project tasks.
Starting the project plan
You can start project plan from different places in the application
- List of projects:
Select one or several project plans and press the project plan icon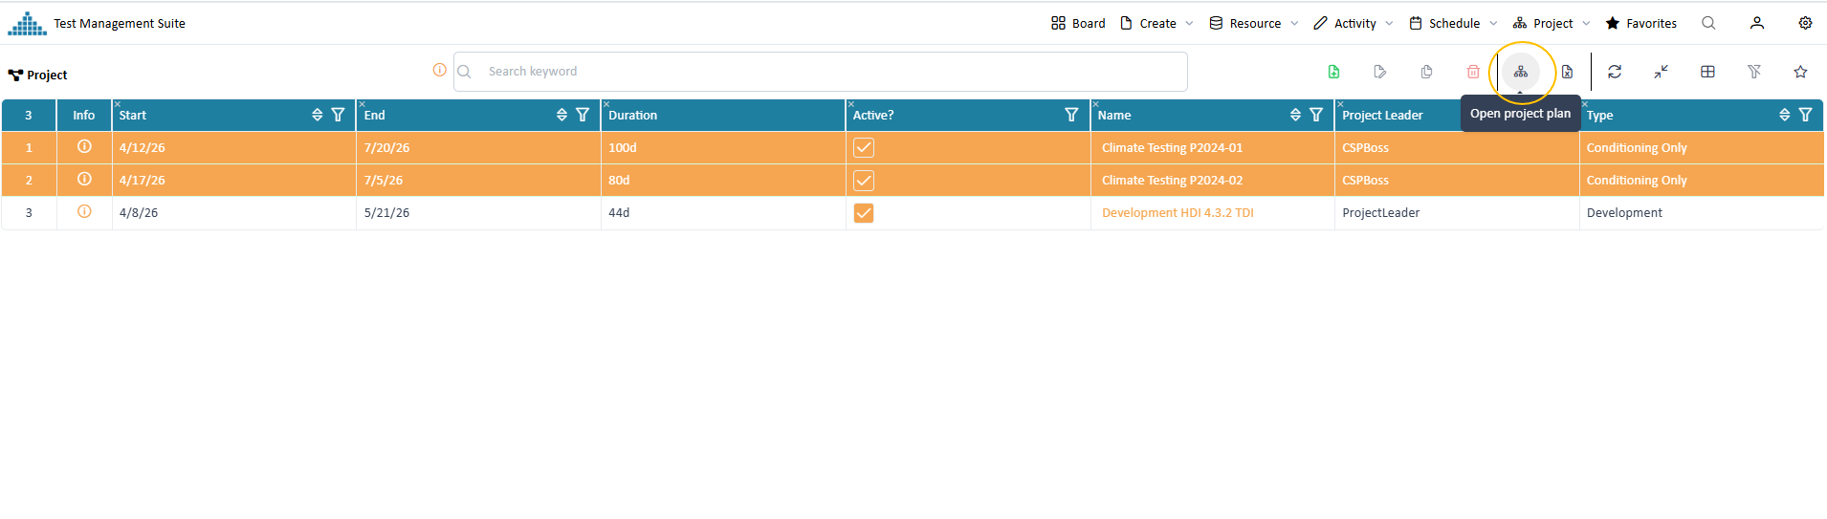
Starting project plan from a list of projects
- Project widget:
Select one or several project plans in a widget on the dashboard and press the project plan icon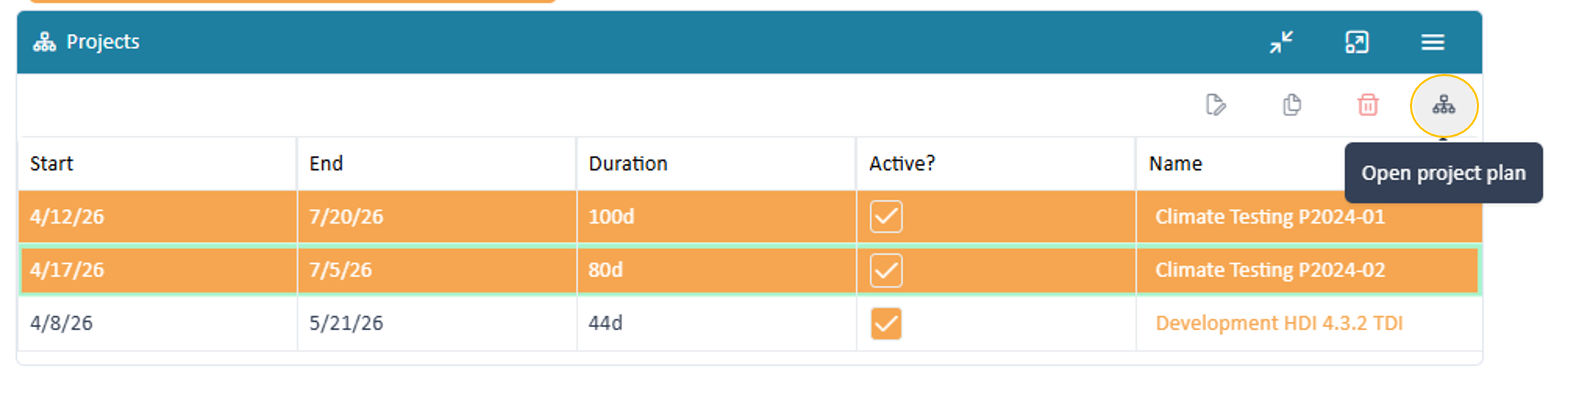
Starting project from dashboard
- Project detail page:
Press the project plan icon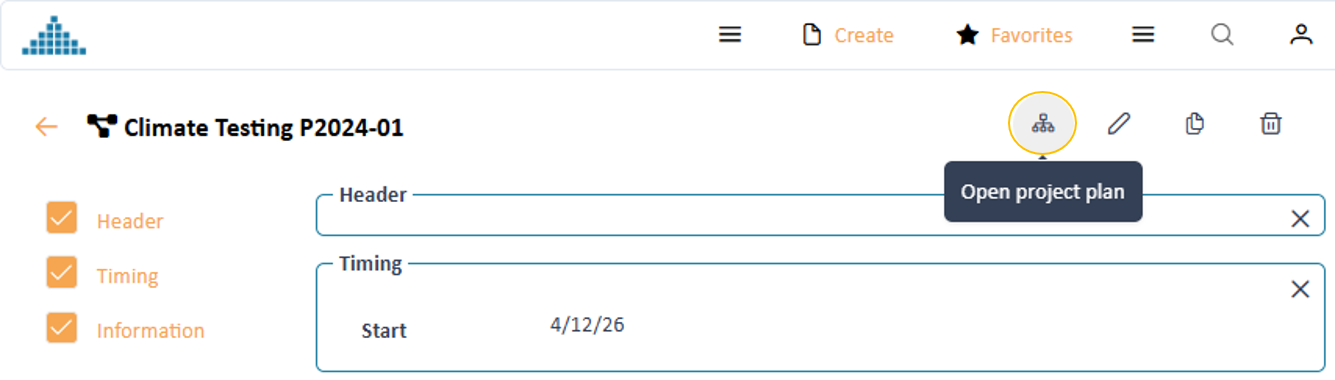
Starting project from detail page
Project planner layout
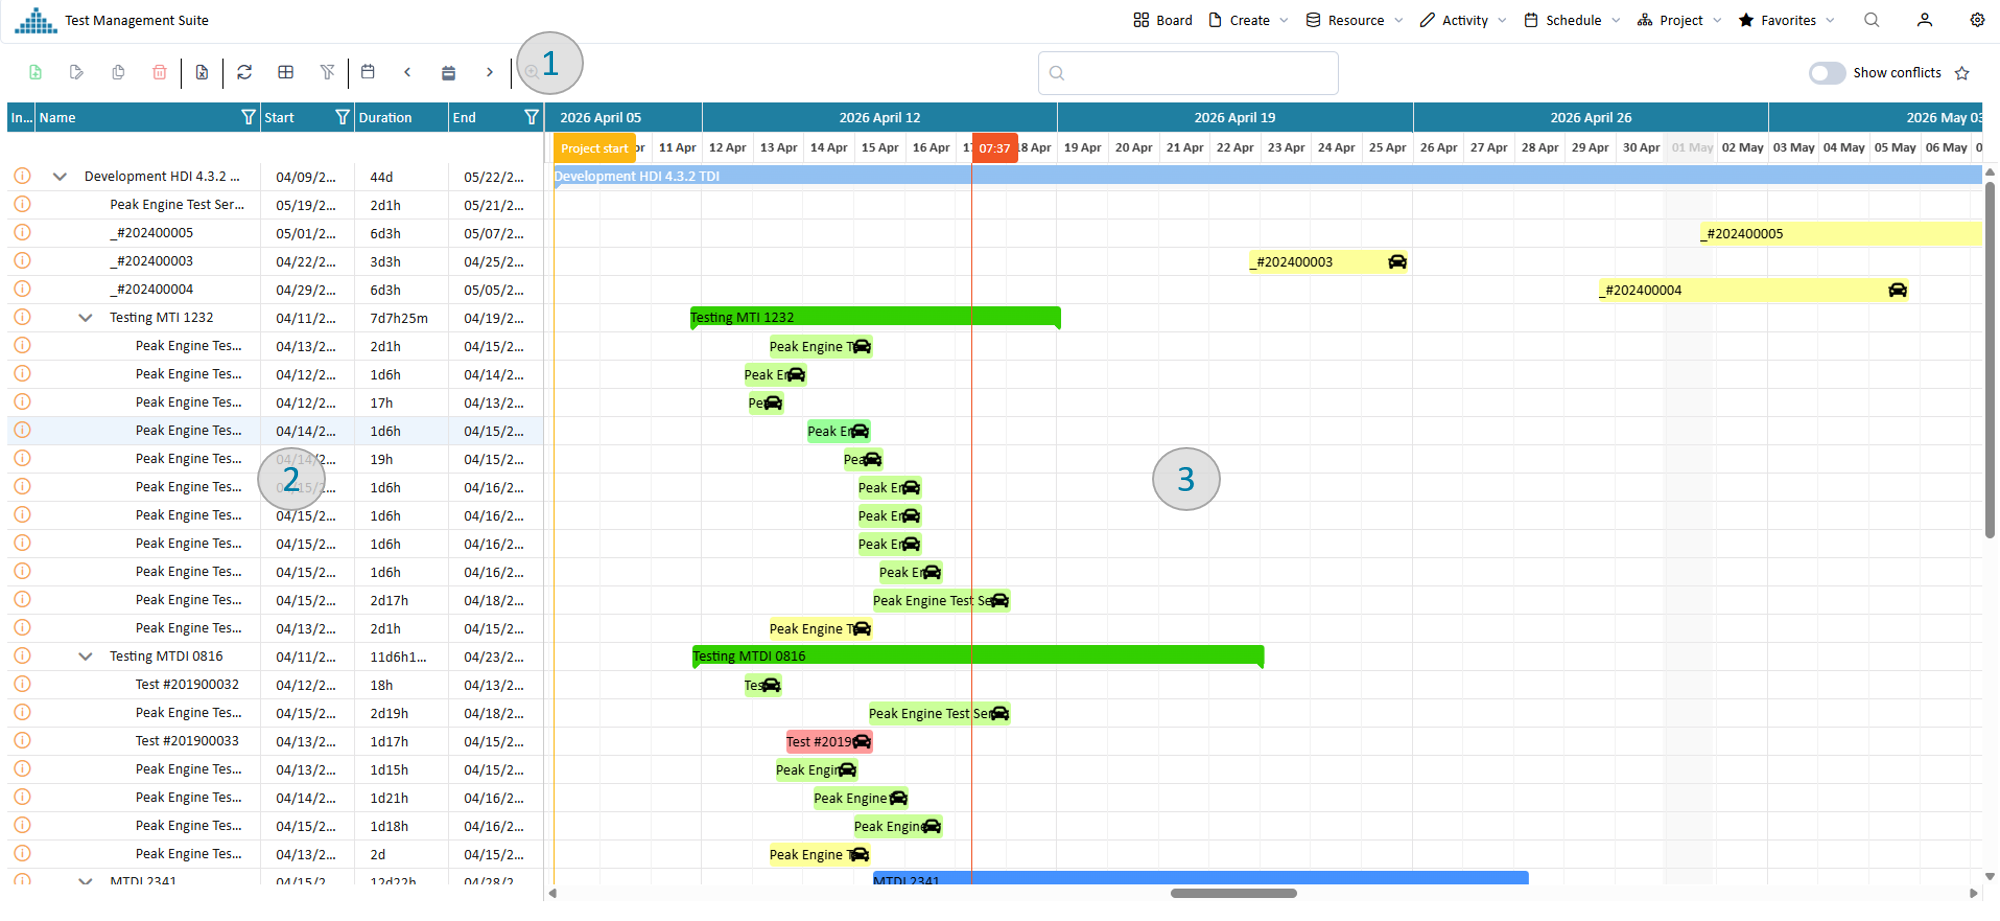
The project plan
The project planner can be divided into 3 areas:
Toolbar
The toolbar on top provides you with the functionality to specify the time frame of your planning, filter data, change display mode or mange your settings.
Data table pool
The data table on the left side allows to display relevant information about the project task. You can choose what relevant information you would like to see there.
Planning board
The planning board graphically shows the different project tasks in a timeline It displays specific relations between them. Start and end of project tasks and the relations between them can be directly maintained via drag and drop.
Adjust the planning board
The project planner provides you with many ways to define which planning time you want to see. Here a few use cases
Define the length of the visible time range
You have different options to define the shown time range quickly.
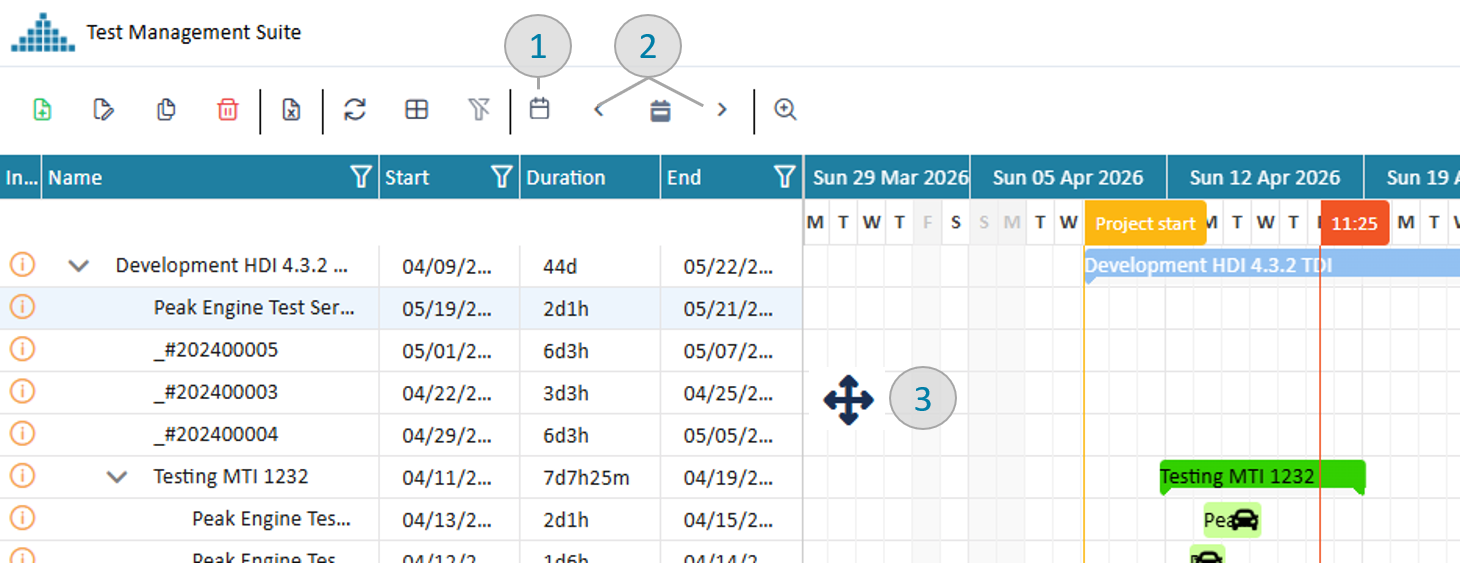
- Option 1: time range button Use the time range button in the navigation toolbar
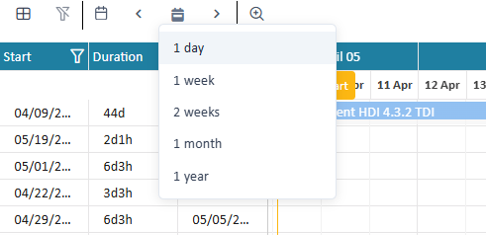
Button to set the time range
- Option 2: context menu Use the context menu of the right mouse button. The advantage of this approach is, that the time range will be exactly
centered around your current mouse position.
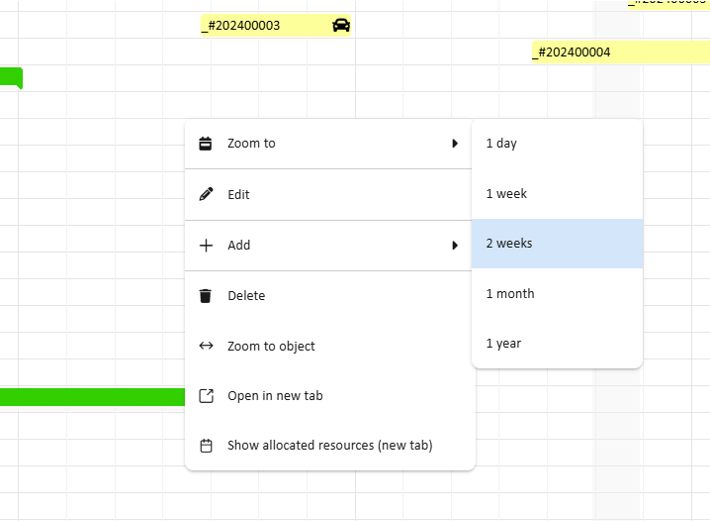
Context menu to set the time range
- Option 3: timeline header Use the header columns of the planning board, e.g. weeks, days or hours. This option only allows to zoom in.
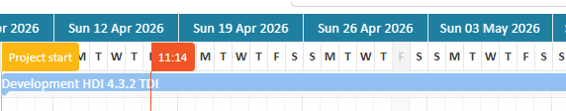
Timeline header to set the time range
- Option 4: Zoom slider You can use the zoom slider in the toolbar to increase / decrease the visible time range.
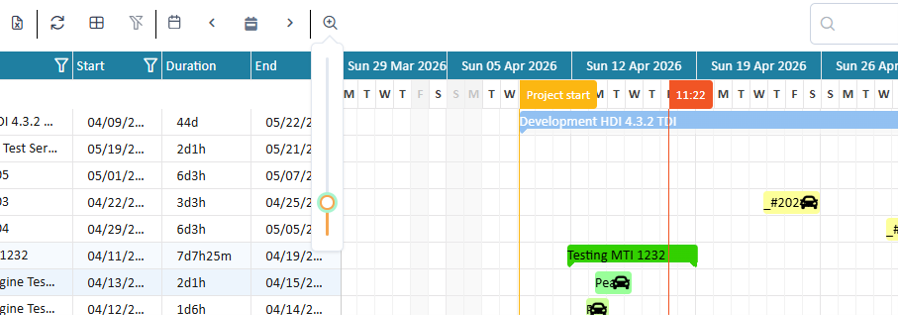
Slider to set the zoom level
- Option 5: Ctrl + mouse wheel You can just use Ctrl + mouse wheel to gradually increase or decrease the visible time range.
Move the visible area
Options to move visible time range
-
Option 1: select date Selecting a date will middle align the shown range around the selected date.
-
Option 2: forward backward buttons Use the forward and backward buttons to "page" the visible area forward and backward.
-
Option 3: drag & drop Click with the mouse into an area on the planning board without activity and drag the shown area to the desired place
Set a kewyord filter
Within the toolbar you can add keywords into the search field. The application will conduct a "deep" search through all activities and only show matching activities, therefore reducing the project plan. In the search all fields and resources involved in an activity will are included in the search base.
Define and work with your data table
Filtering
To filter the shown data you can set a list of different filters.
Project plan toolbar and table header
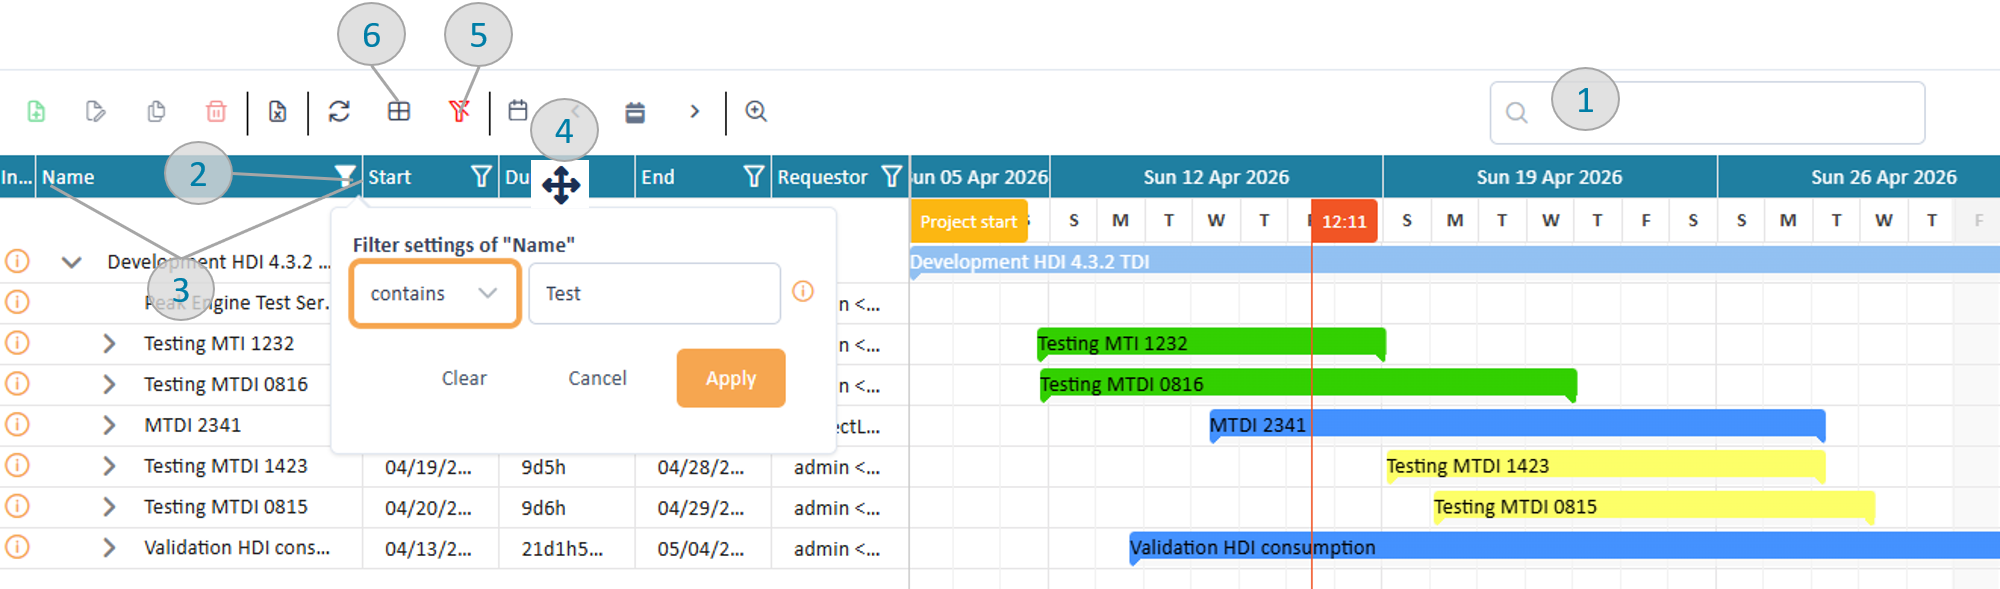
Key word filter (pic 1)
Entering one or several keyword expressions will search the entire data structure of each task and add it to the filtered data. If you use several keywords, then they are "AND" connected. E.g. "Stuttgart electric" will only return data which contains Stuttgart and electric. Thereby both words can appear in different places of the task.
Column filter (pic 2)
On top of the most columns the filter symbol provides filter options. Depending on the content type (e.g. text, number, date) different filter options will be provided. All column filter are "AND" connected therefore reducing the amount of shown data. Column filters can also be used together with the key word filter.
All filters can be cleaned using the clean-filter button (pic 5)
Adjust table columns
All columns can be adjusted in width by moving the separator between the column headers (pic 3). The order of the columns can be changed by you via dragging the column header to the desired position (pic 4).
With the column selector (pic 6) you can select additional columns to your table configuration.
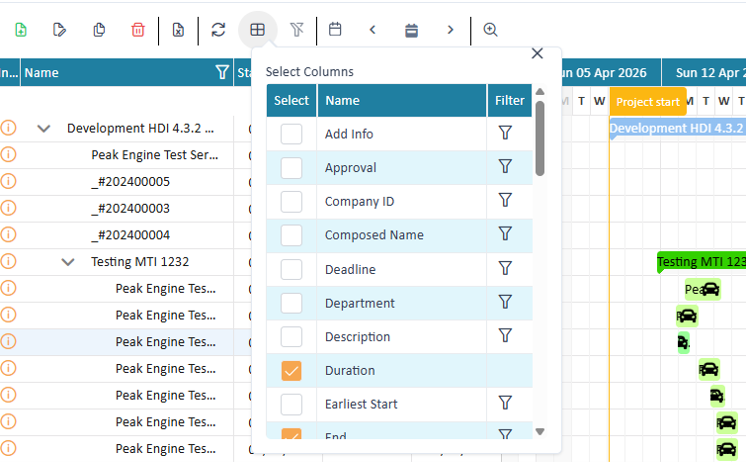
Column selector
Within the column chooser you can also set column filters. This becomes particular interesting if you want to filter data by a column but not see the column. E.g. if your filter all data by a just one location, there is no point to display that column in which each row has the same value.
Inspect details / edit task
When you (double) click onto a task in the table or planning board details will be opened in a new dialog. Read in activity detail page about it. Alternatively you can 'Right click' an activity and choose "edit" to get to the edit mode.
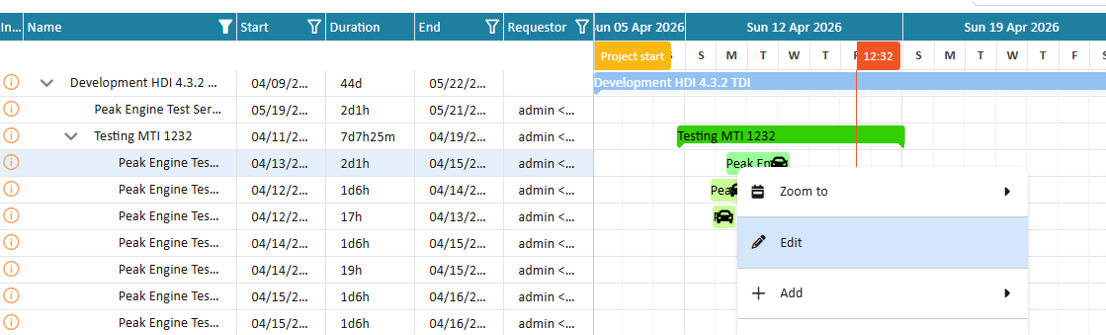
Start editing an activity
Create new tasks
Depending on your selection in the data table the system will allow to:
- add task below:
A new activity will be added after the selected row on the same level. - add task above:
A new activity will be added before the selected row on the same level. - add sub task:
A new activity will be added on top in the tree level below the selected node.
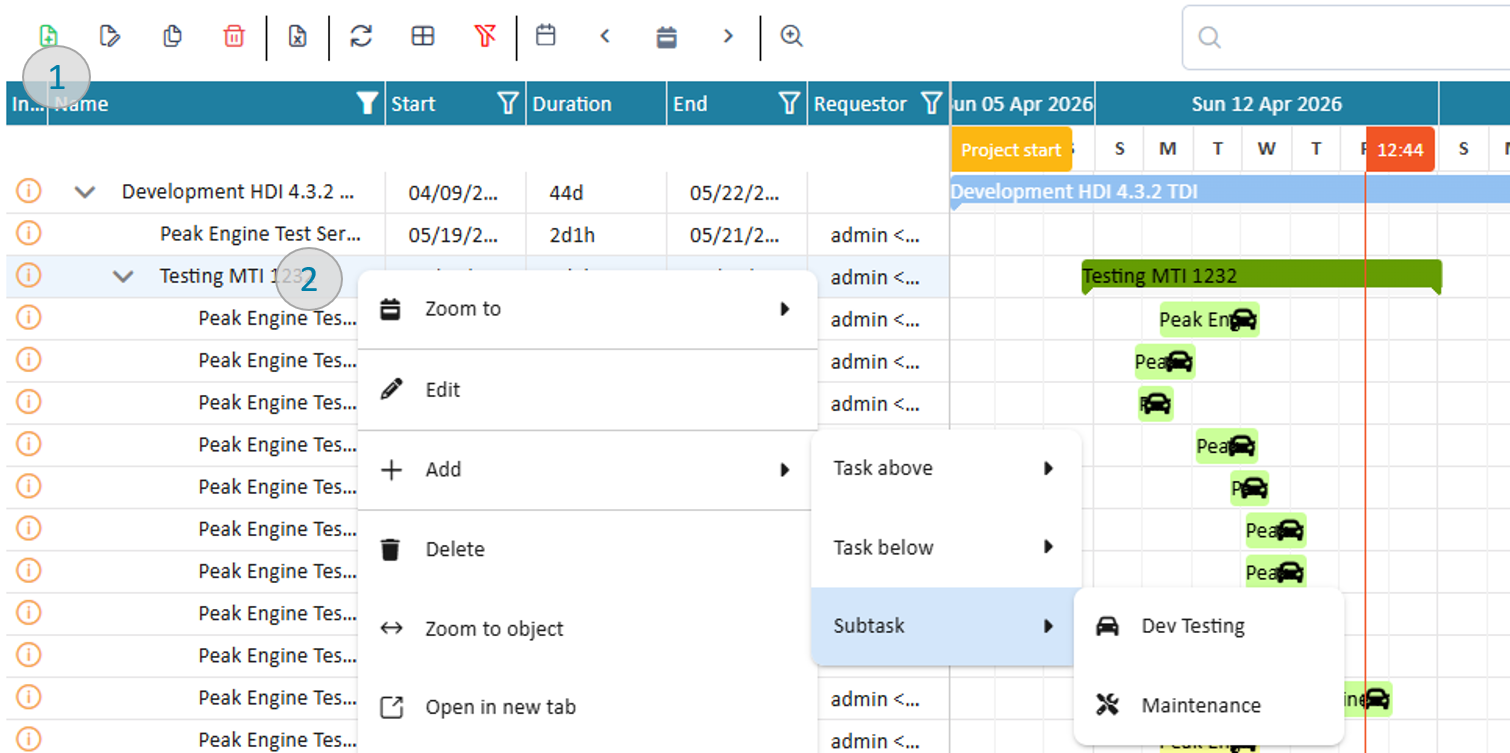
Add a project task
You can trigger the actions either via the button in the toolbar or the right mouse context menu.
In all cases a dialog in edit mode will open.
Change task position in project plan
To change the position of a task you can drag the corresponding table row: While moving you will see an orange line which indicates the new position. Once you drop the task it will be placed at the new position, if no business constraint is violated.
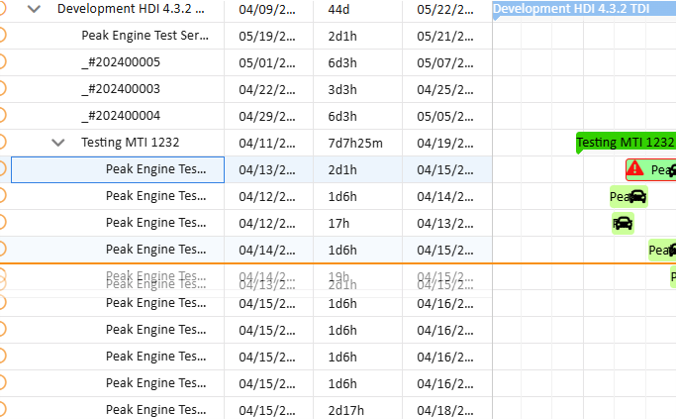
Change the task position in a project tree
Tasks can be moved within the same tree level or from an upper level into a lower level. Dragging a task out of its current parent is up to now not permitted!
Maintain relations between project tasks
Between the different tasks relationships may exist. Lookup relationships for more detailed information. The relationships are visualized in the planning board by lines from the predecessor to the successor. Once relationship are set the system will automatically adjust dependent tasks to honor the relationship specification.
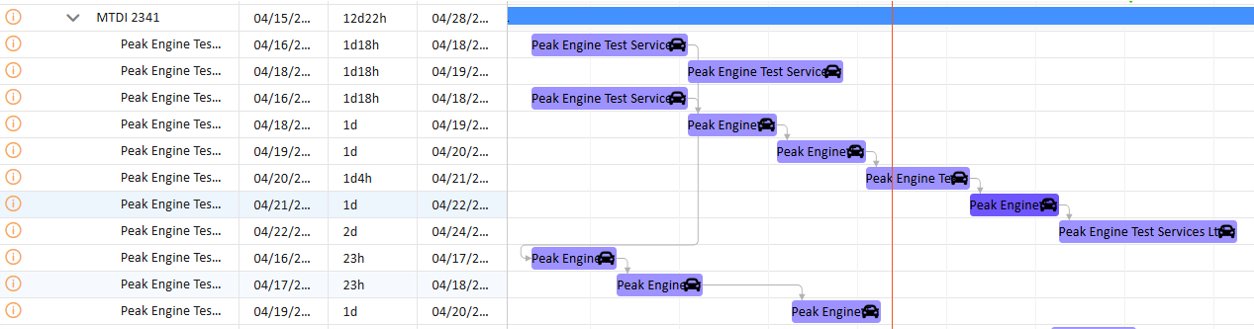
Project relation ships
Create new relations
You can create new relations by selecting the beginning or end of a task. Keep the mouse pressed and move over the planning board. A line symbolizing the relation will appear. Move the end of the line above another task. A symbol will inform you if this relation is possible or not.
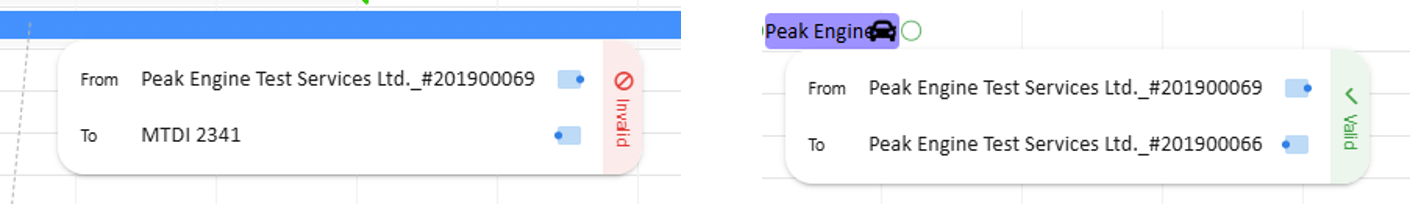
Example of valid and invalid target for relationship
Depending on which ends of the tasks you connect PeakTMS will create you an
- BEGIN_BEGIN relationship, in case you selected the left edge of both tasks
- END_BEGIN relationship, in´case you selected the right edge of the first and the left edge of the 2nd task
- END_END relationship, in case you selected the right edge of both tasks
When releasing the mouse the system will open a dialog to ask for more details, in particular about the delay. The dialog will be filled with the currently calculated delay. You can approve or change the value. In this case the system will make sure that this exact amount is always ensured. In case no specific delay shall be defined, just empty the field.
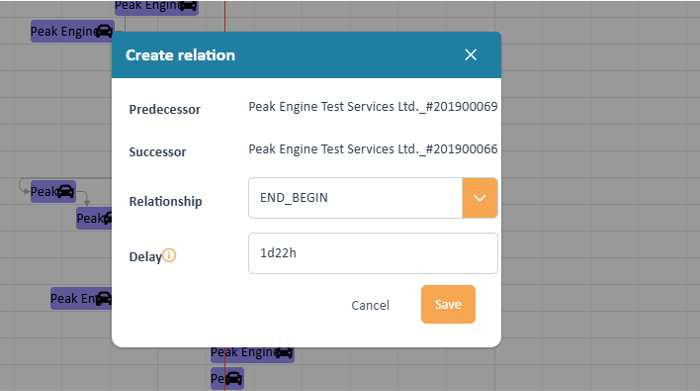
Edit the relationship
Change an existing relation
"Double click" on an existing relation allows to change the relation type and the delay of a relationship.
Delete a relationship
Within the project planner there are 2 ways to delete a relationship.
- Select a relationship, press right mouse button and select "Delete relationship" in the context menu image: "context menu"
- Select a relationship and click the remove icon
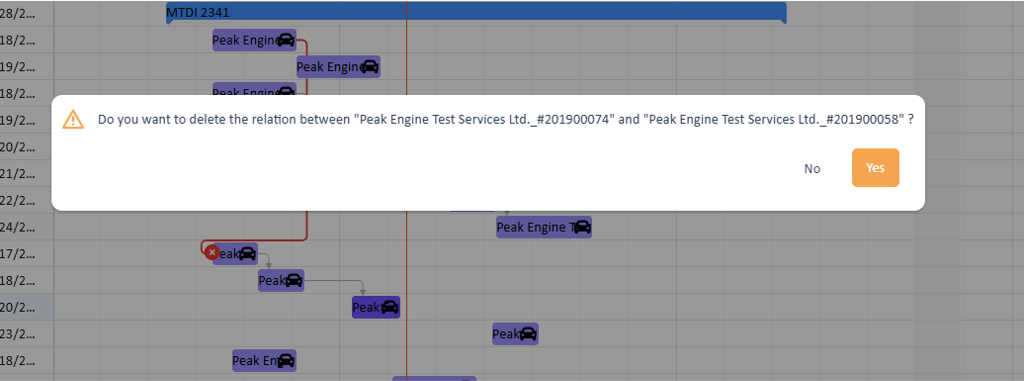
Delete a relationship
Working on resource conflicts
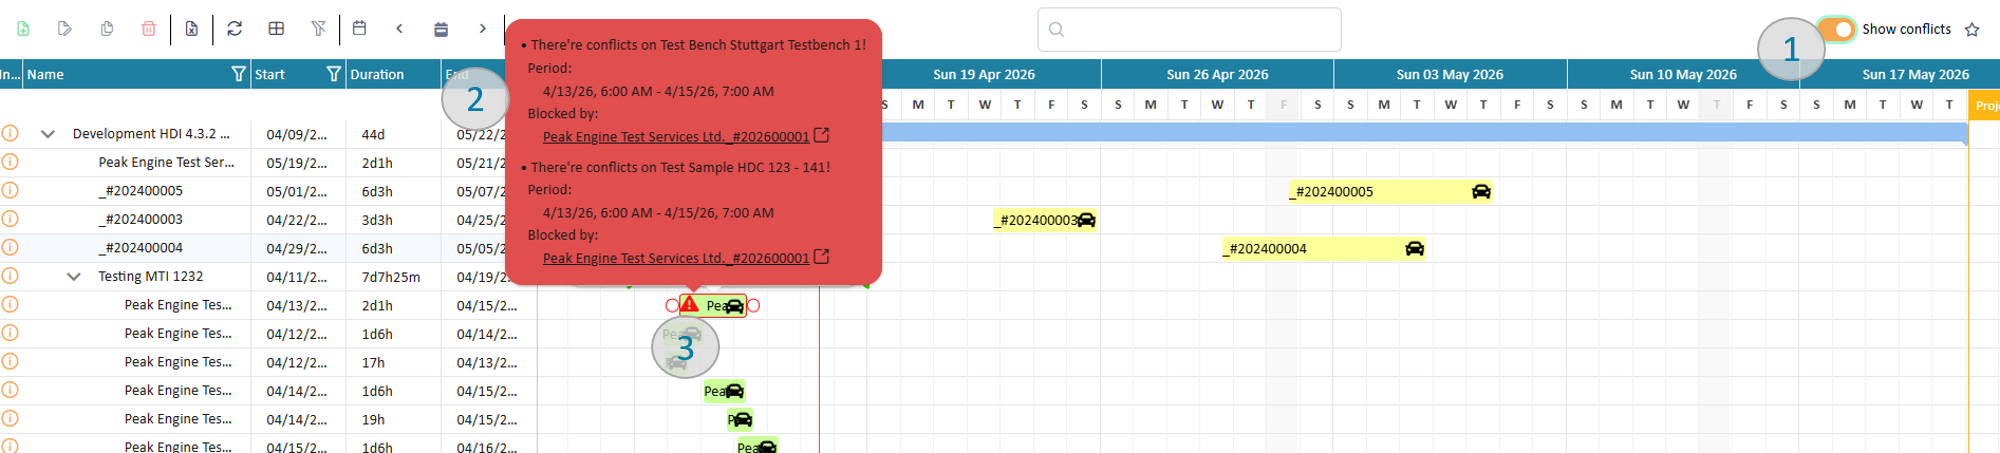
Working with conflicts
When switching on "show conflicts" (pic 1) the system marks activities with a red frame if there is a scheduling conflict in at least one of the resources assigned to it.
Hovering over the symbol will provide a message which explains where the conflict comes from and provide a link to activities which try to use the same resources. Clicking the link will open the detail page of the related activity in a new browser tab.
Helpful is to get an overview over all resources assigned to the activity therefore right click the activity and choose the menu item "show allocated resources".
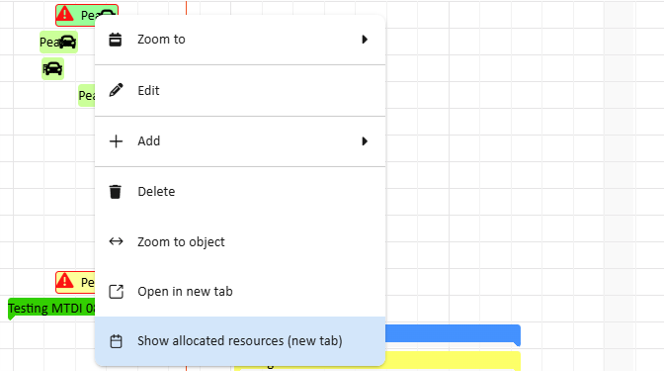
Show already assigned resources
This will open a new browser tab showing the schedule of all assigned resources, in this example test bench, test sample and test engineer:
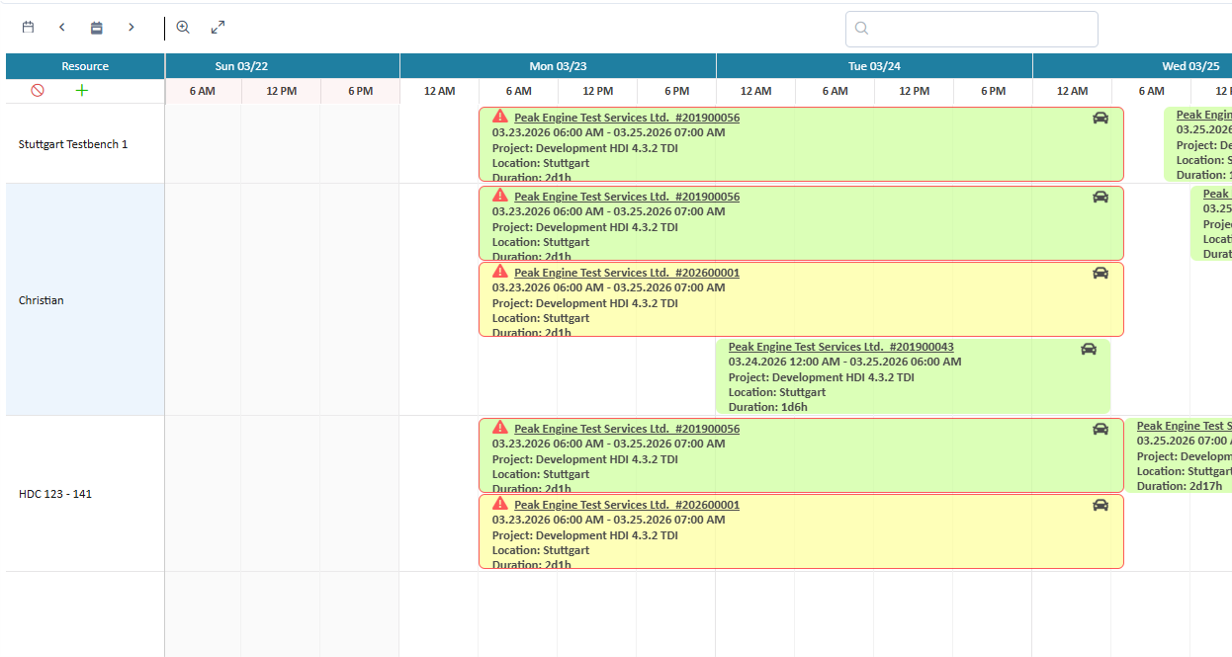
Overview of all assigned resources
Using this view helps to see the source of conflicts and adjust the planning.
Store and reuse your settings
You can store your current settings as a favorite, pressing the button. After saving the button will change to to mark that you are working within a favorite.
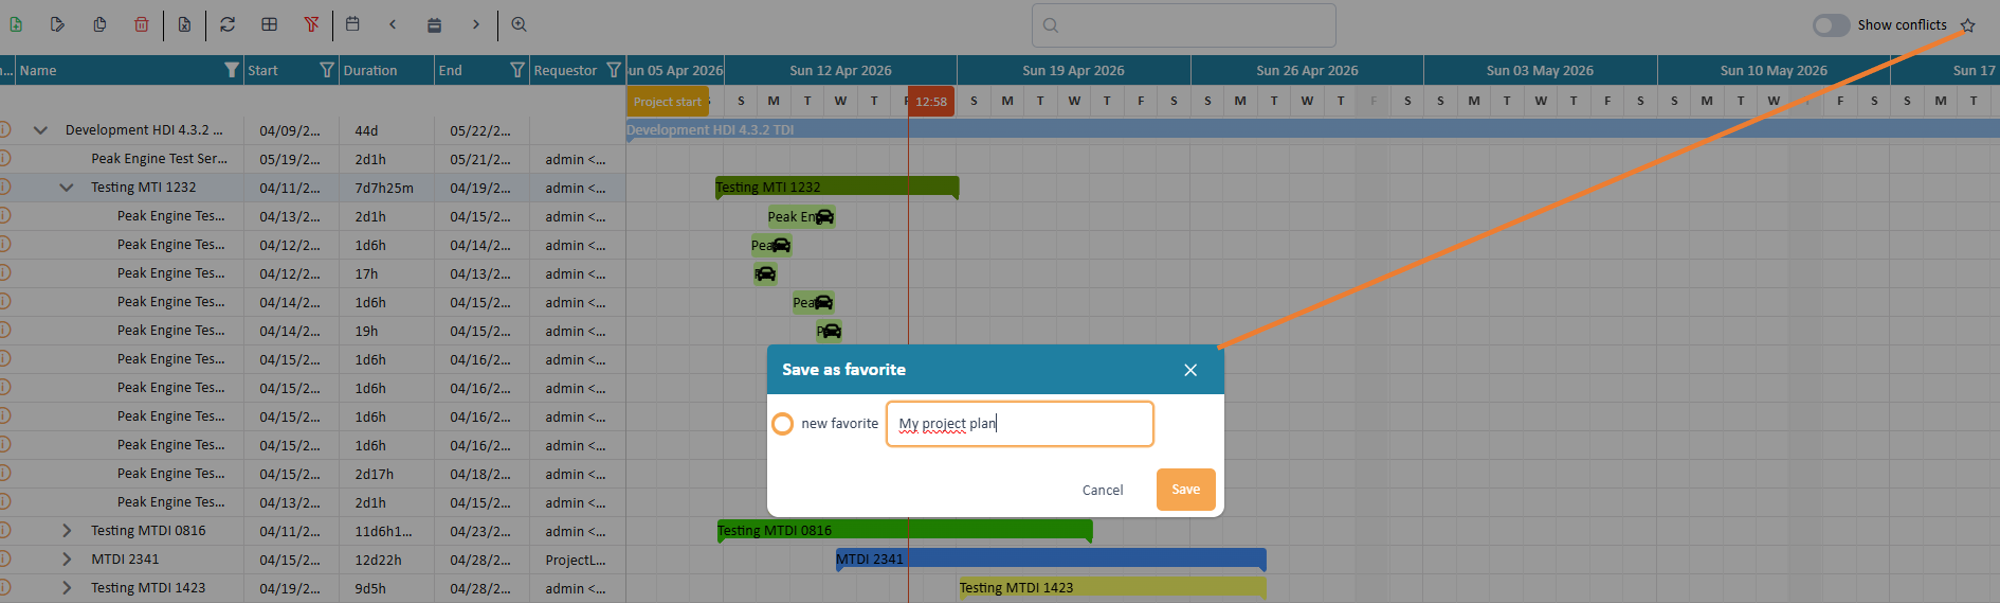
Save settings as favorite
Following information will be stored:
- Visible time range
- Data table configuration with columns and filter
- Conflict on / off