Activity list chart
The list char is an add-on component on the activity manager which helps to group and visualize activities based on individual criteria. The list chart is available in the activity manager and can be used to visualize activities in a Gantt chart like view, without the need to maintain a project plan.
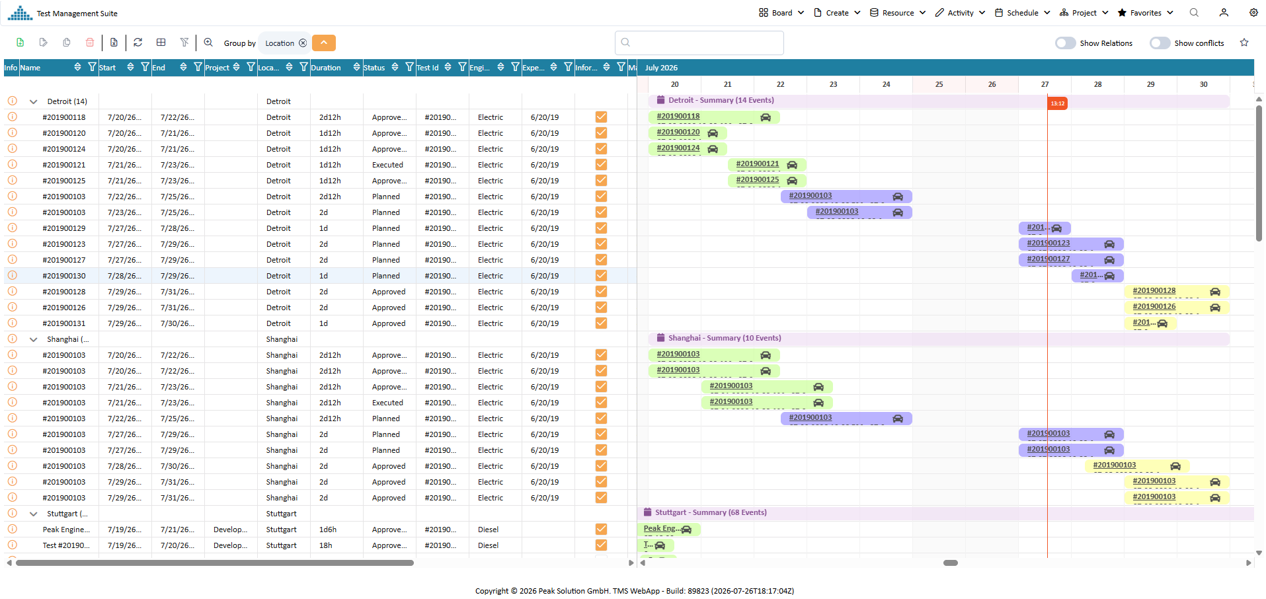
The activity list chart
The list chart provides the same functions as the activity manager, but additionally provides the possibility to define time slots by drag & drop, group the data by diverse criteria as well as to visualize relationships between activities and graphically maintain them.
For the general functions of the list view, please refer to the activity manager documentation. This page will focus on the additional functions of the list chart.
Starting a list chart
The activity list chart is an add-on on the activity manager. It can be started from there using the list-chart icon in the toolbar.
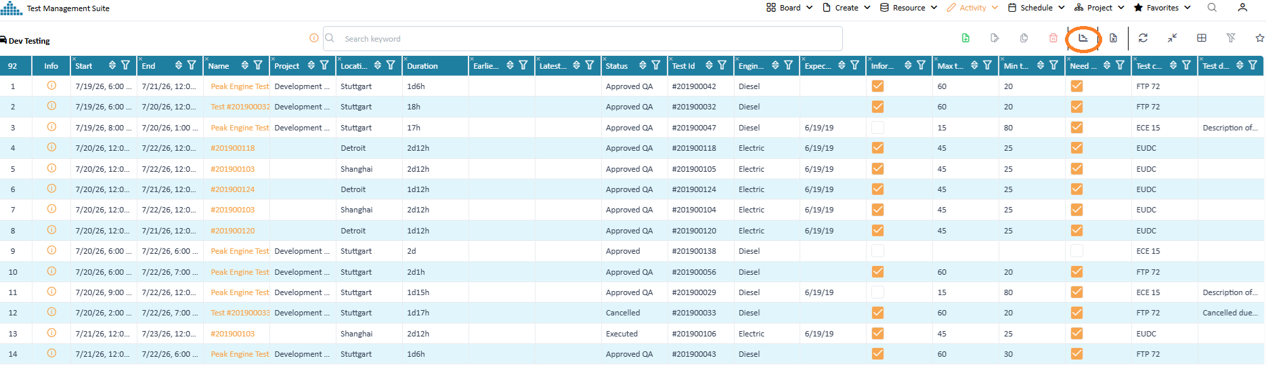
Starting the list chart
The list chart shows at maximum 10 000 activities for grouping and visualization. If the activity manager shows more than 10 000 activities, you need to use filter functions to reduce the number of activities to be displayed in the list chart.
Define the list view and scheduling area
The list chart consists of two areas. The left area shows the list view of the activities, the right area shows the scheduling area. The scheduling area is shown as a timeline in the right area of the list chart. Use the slider in the middle to increase the adjust the size of the list view and scheduling area.
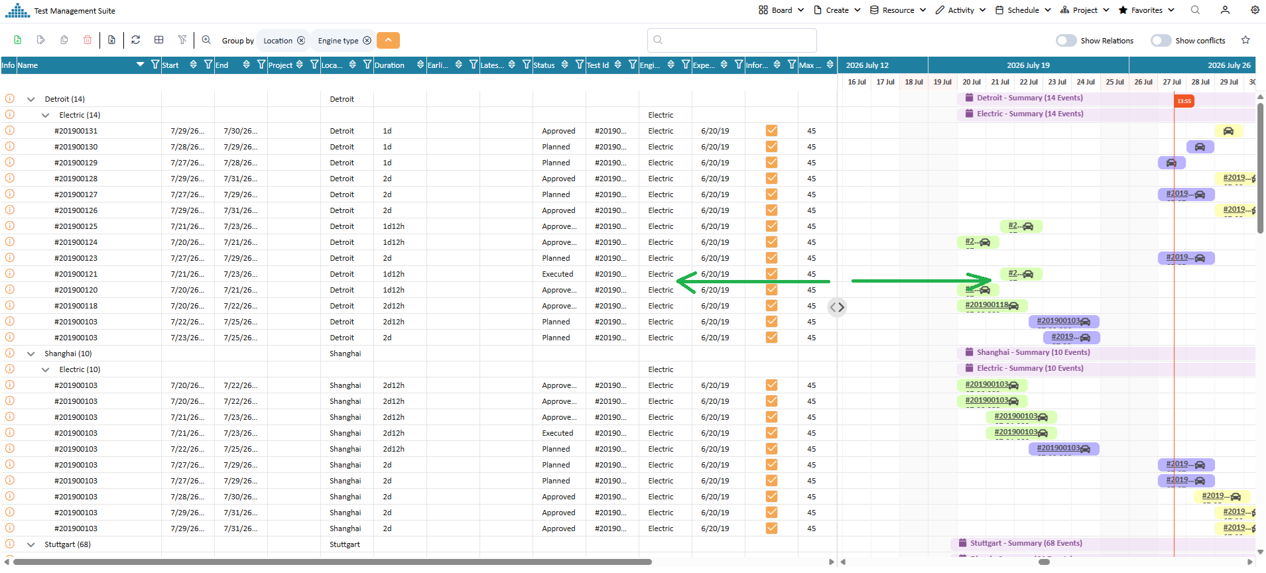
Use the slider to define the size of list area and scheduling area
Grouping activities
Using the group functionality an activity list chart can be grouped by one or more criteria. The grouping is done in the toolbar in the group by area. Here columns of activities or assigned resources can be selected to group the activities. The grouping is done in the order of selection. Afterward the grouping order can be changed by drag & drop of the group criteria in the group by area. The grouping criteria can be removed by clicking on the x icon in front of the group criteria.
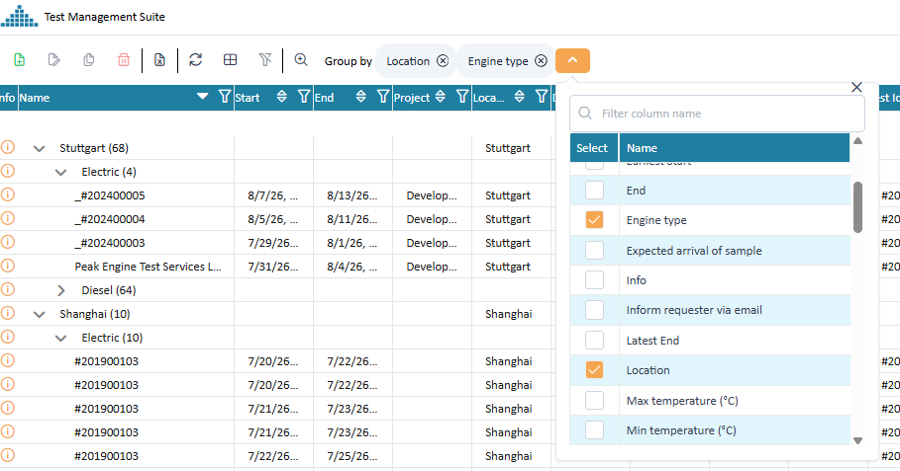
Grouping the data by criteria
Visualize and manage relationships between activities
Between the different activites relationships may exist. Lookup relationships for more detailed information. The relationships are visualized in the planning board by lines from the predecessor to the successor. Once relationship are set the system will automatically adjust dependent tasks to honor the relationship specification. To visualize existing relationships, click the "show relations" button in the toolbar. T the system will show all existing relationships between the activities.
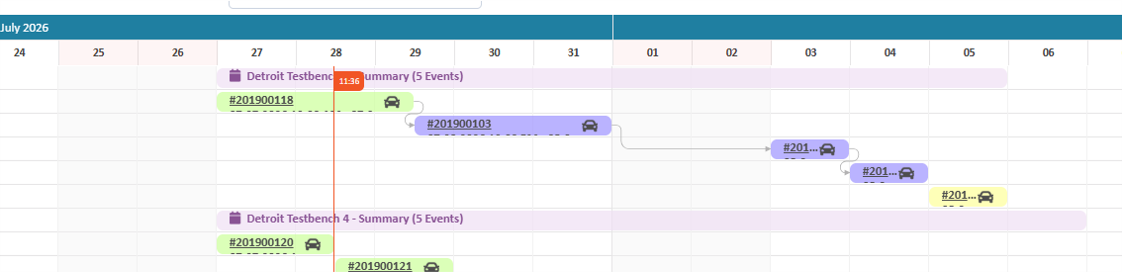
Relation ships between activities
Create new relations
You can create new relations by selecting the beginning or end of an activity. Keep the mouse pressed and move over the planning board. A line symbolizing the relation will appear. Move the end of the line above another activity. A symbol will inform you if this relation is possible or not.

Example of valid and invalid target for relationship
Depending on which ends of the tasks you connect PeakTMS will create you an
- BEGIN_BEGIN relationship, in case you selected the left edge of both tasks
- END_BEGIN relationship, in´case you selected the right edge of the first and the left edge of the 2nd task
- END_END relationship, in case you selected the right edge of both tasks
When releasing the mouse the system will open a dialog to ask for more details, in particular about the delay. The dialog will be filled with the currently calculated delay. You can approve or change the value. In this case the system will make sure that this exact amount is always ensured. In case no specific delay shall be defined, just empty the field.
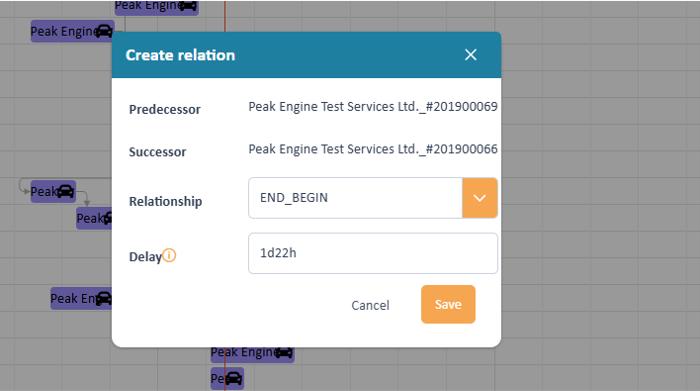
Edit the relationship
Change an existing relation
"Double click" on an existing relation allows to change the relation type and the delay of a relationship.
Delete a relationship
Within the project planner there are 2 ways to delete a relationship.
- Select a relationship, press right mouse button and select "Delete relationship" in the context menu image: "context menu"
- Select a relationship and click the remove icon
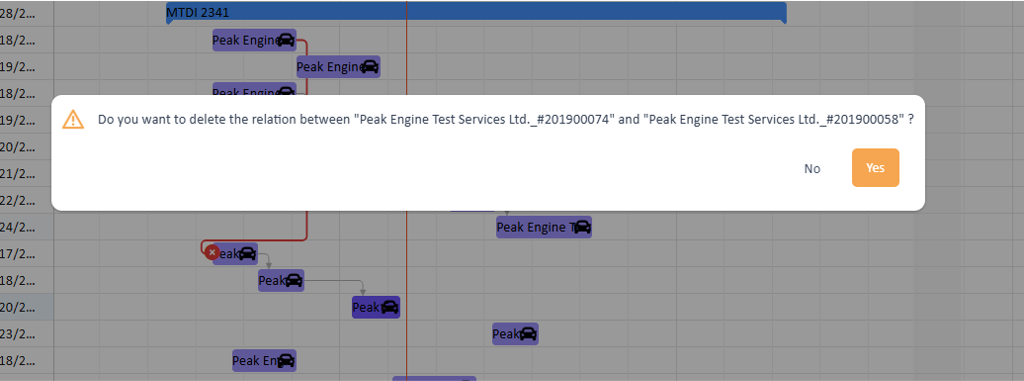
Delete a relationship
Working on resource conflicts
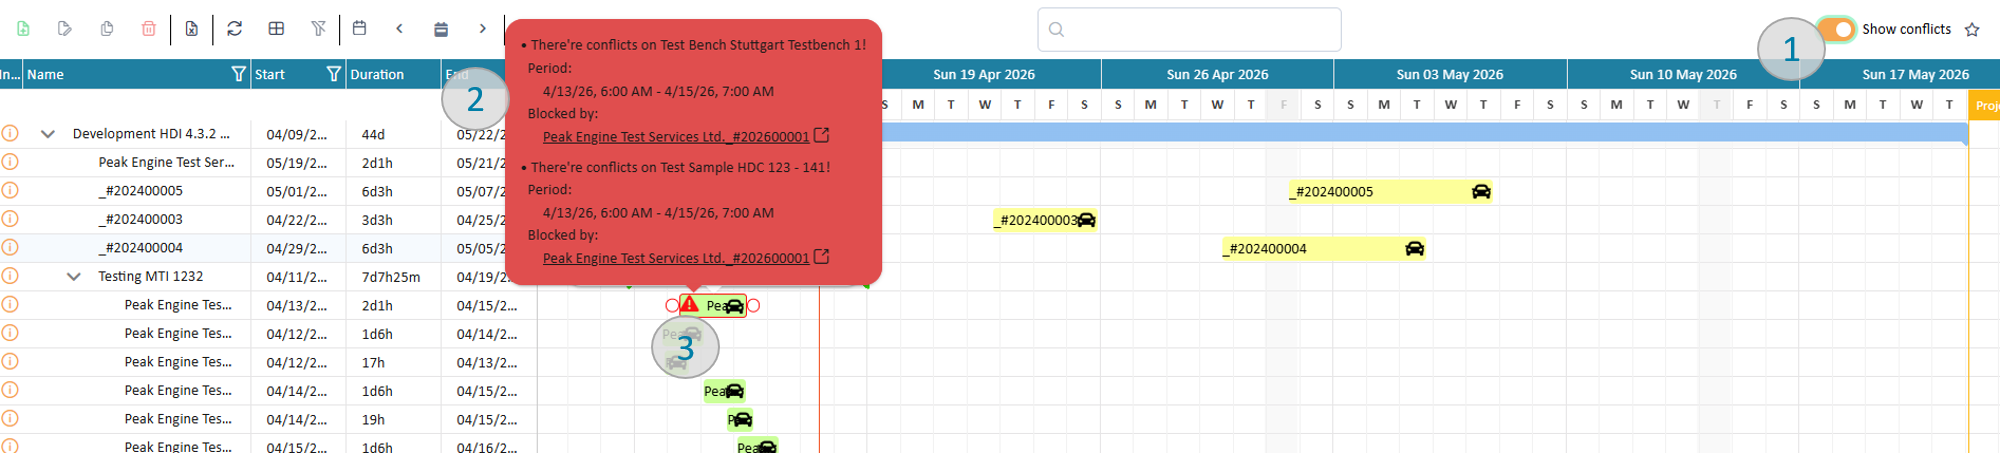
Working with conflicts
When switching on "show conflicts" (pic 1) the system marks activities with a red frame if there is a scheduling conflict in at least one of the resources assigned to it.
Hovering over the symbol will provide a message which explains where the conflict comes from and provide a link to activities which try to use the same resources. Clicking the link will open the detail page of the related activity in a new browser tab.
Helpful is to get an overview over all resources assigned to the activity therefore right-click the activity and choose the menu item "show allocated resources".
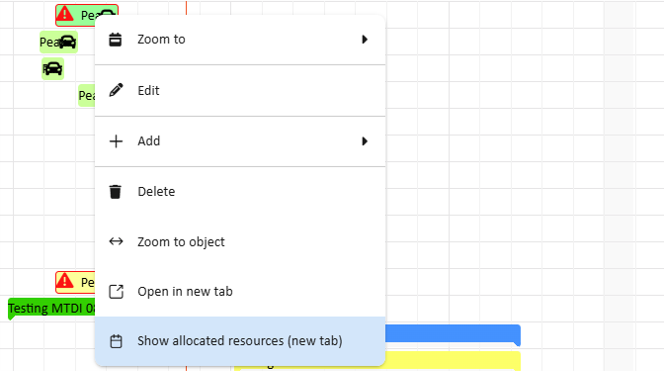
Show already assigned resources
This will open a new browser tab showing the schedule of all assigned resources, in this example test bench, test sample and test engineer:
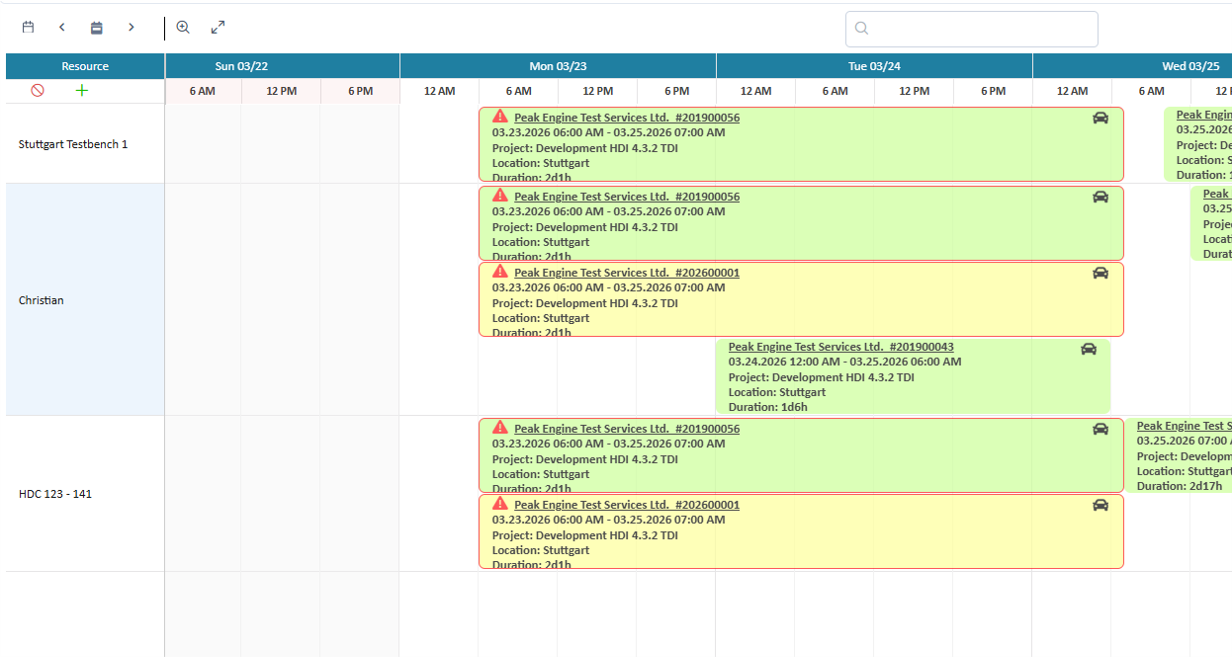
Overview of all assigned resources
Using this view helps to see the source of conflicts and adjust the planning.